Pages

Tuesday, December 24, 2013

OBIEE 11g Title view Image position

The controlling file for the GUI rendering with regards to the title view is in the msgdb. 

It's the /messages/standardviewtemplates.xml

Changes to be made are here:

Standard:

<WebMessage name="kuiTitleViewDisplay" translate="no">  
  <HTML>  
    <table class="TitleTable" cellspacing="0" style="@{tableStyle}"  
    width="100%">  
      <sawm:if test="logo || title || help">  
        <tr>  
          <sawm:if name="logo">  
            <td class="TitleLogo" style="@{logoStyle}" rowspan="4">  
            &lt;img border="0" src="  
            <sawm:param name="logo" />alt="  
            <sawm:messageRef name="kmsgTitleViewLogo" />title="  
            <sawm:messageRef name="kmsgTitleViewLogo" />"/&gt;</td>  
          </sawm:if>  
          <sawm:if name="title">  
            <td class="TitleCell" style="@{titleStyle}"  
            title="@{desc}">  
              <sawm:param name="title" />  
            </td>  
          </sawm:if>  
          <sawm:if name="help">  
            <td class="TitleHelp" align="right" rowspan="4">  
              <a href="@{help}" target="_blank">  
                <img border="0" alt="" src="fmap:Views/Help.gif" />  
              </a>  
            </td>  
          </sawm:if>  
        </tr>  
      </sawm:if>  

After changes:

<WebMessage name="kuiTitleViewDisplay" translate="no">  
  <HTML>  
    <table class="TitleTable" cellspacing="0" style="@{tableStyle}"  
    width="100%">  
      <sawm:if test="logo || title || help">  
        <tr>  
          <sawm:if name="title">  
            <td class="TitleCell" style="@{titleStyle}"  
            title="@{desc}">  
              <sawm:param name="title" />  
            </td>  
          </sawm:if>  
          <sawm:if name="help">  
            <td class="TitleHelp" align="right" rowspan="4">  
              <a href="@{help}" target="_blank">  
                <img border="0" alt="" src="fmap:Views/Help.gif" />  
              </a>  
            </td>  
          </sawm:if>  
          <sawm:if name="logo">  
            <td class="TitleLogo" style="@{logoStyle}" rowspan="4">  
            &lt;img border="0" src="   
            <sawm:param name="logo" />alt="   
            <sawm:messageRef name="kmsgTitleViewLogo" />title="   
            <sawm:messageRef name="kmsgTitleViewLogo" />"/&gt;</td>  
          </sawm:if>  
        </tr>  
      </sawm:if> 

 Basically you switch around the order of Logo -> Title -> Help to Title -> Help -> Logo. This way you know what happens in the doce above and make it Title -> Logo ->

20 Golden Rules For Repository Design

PHYSICAL LAYER

1.When modelling a star schema data model, create aliases for all your physical tables (prefixed with either “Dim_”, “Fact_” or “Fact_Agg_”

2.When possible, configure your connection pools to use a “native driver” to connect to your physical databases. For example, use OCI for connecting to an Oracle database rather than ODBC.

3.Make sure the “Max Connections” parameter on your connection pools are appropriately set (not too low....not too high!). If in doubt, you can use the following formula which assumes that no more than 4% of your users will ever be logged on and running a report at any one moment:

Max Connections = Total Users * 0.04 *Max Reports on a Dashboard

So if you have 1000 users and you have no more than 4 reports on any one dashboard, then your

“Max Connections” should be set to 160.

NOTE: It is easy to exaggerate the number of users who will be using the dashboards simultaneously

BMM LAYER

4.All Logical Tables should be prefixed with either “Dim –“, “Fact –“ or “Fact Compound –“.

5.No “physical” column names should ever be seen on the Business Model layer. All naming conventions should be “business oriented”. For example use “$ Revenue” rather than “DOLLARS”.

6.Physical Primary Keys or Surrogate Keys should not be present on the Business Model layer (unless, for example, you have a Primary Key such as Order Id which will be displayed on reports).

7.Dimension Logical Tables must always have a Logical Key assigned. The Logical Key should be something “business oriented” such as “Employee Login” rather than “EMPLOYEE_PK”.

8.Dimension Logical Tables must only contain dimension attributes, they should never contain any measure columns (which have an Aggregate rule).

9.Fact Logical Tables should never have a Logical Key assigned
10.Every Logical Column within a Fact Logical Table must be a measure column, and therefore have an Aggregation Rule assigned.

11.The Business Model should only consist of logical star-schemas, there should not be any snow-flaking.

12.Every Dimension Logical Table should have a corresponding Dimension Hierarchy (with “Total” as a Grand Total level, and “Detail” at the lowest level.

13. Each level of a Dimension Hierarchy should have its “Number of Elements” appropriately set (there is a utility that can do this automatically for you).

14. Every Logical Table Source within every dimension and fact Logical Table should have its “Content Levels” appropriately set.The only time the “Content Level” is not set for a particular dimension is when there is no logical relationship existing.

15.Do not merge all your measures into a single Fact Logical Table. For example, you should split “Forecast Sales” and “Actual Sales ” measures into two Logical Tables e.g. “Fact–Sales” and “Fact–Forecast”.

16.For your Dimension Hierarchies, only enable the “Ragged” and “Skip Level” options if your hierarchies genuinely contain Ragged and/or Skip Levels..

PRESENTATION LAYER

17.When you have multiple Subject Areas, list the common dimensions in the same order across all the Subject Areas.

18.Presentation Table names within each Subject Area must not begin with “Dim–“ or “Fact –“ or “Fact Compound –“. So remove these prefixes if they are present after creating the Subject Area by dragging Logical Tables directly from the Business Model.

19.The “Time” presentation table should be listed as the first Presentation Table in each subject area. The Presentation Table containing your facts should be listed right at the bottom, and the Presentation Table should be called “Measures”.

20.There should be absolutely no possibility of a user selecting objects from a Subject Area that have no logical relationship. So, if there are any objects within the same Subject Area that cannot co-exist in the same report, then your Subject Area design is incorrect! (Remember, users can configure an Analysis to source from multiple Subject Areas, so you don’t have to cram all your objects in one Subject Area).

Monday, December 23, 2013

Data visualizations practice

The data: 

Decade    Global temperate in °C
1881-1890 13.68 
1891-1900 13.67
1901-1910 13.59
1911-1920 13.64
1921-1930 13.76
1931-1940 13.89
1941-1950 13.95
1951-1960 13.92
1961-1970 13.93
1971-1980 13.95
1981-1990 14.12
1991-2000 14.26
2001-2010 14.47


How the data appears in a bar graph if plotted with the Y-axis starting at 13.4:


How the data appears in a bar graph if plotted with the Y-axis starting at 0.


For time-series data I think the line graph is much better suited as a data visualization. The same data if plotted as a line graph:
 
First, with the Y-axis starting at 13.4:
 
And now with a normal, unbroken Y axis that starts at zero:


When you resort to such gimmickry to buttress your point, it not only hurts your credibility but also harms the cause.
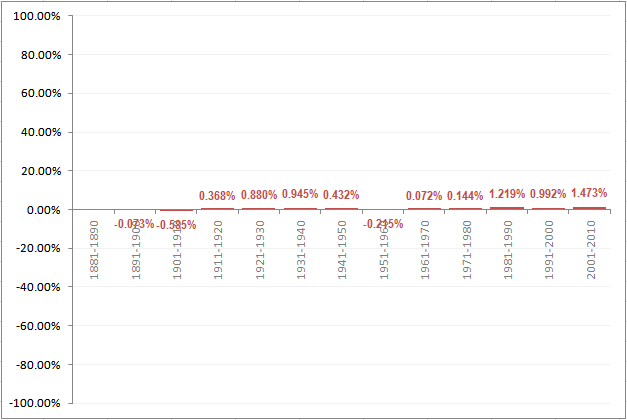
Update: what if we decide to plot the inter-decade differences in temperatures as a percentage difference? Would that make a difference? Perhaps, but here again, the choice of scale you use makes a huge difference in perception.
Using a scale to maximize differences.
 

Using a scale that ranges from -10% to +10%


Using a scale that ranges from -100% to +100%:


Sunday, December 22, 2013

Auto Complete OBIEE 11G Dashboard Prompts

Step 1- Add the following lines in the instanceconfig.xml file above the sever instance tag
 
 <Prompts>
<MaxDropDownValues>256</MaxDropDownValues>
<AutoApplyDashboardPromptValues>true</AutoApplyDashboardPromptValues>
<AutoSearchPromptDialogBox>true</AutoSearchPromptDialogBox>
<AutoCompletePromptDropDowns>
<SupportAutoComplete>true</SupportAutoComplete>
<CaseInsensitive>true</CaseInsensitive>
<MatchingLevel>MatchAll</MatchingLevel>
<ResultsLimit>50</ResultsLimit>
</AutoCompletePromptDropDowns>
</Prompts>
</ServerInstance>

Step 2- Edit the Dashboard prompt and enable the use inputs.


 Step 3-In the Dashboard Properties, make sure the settings are as below

 Step 4- Verify the results

Heat Map in OBIEE

Steps to Create Heat Map in OBIEE 

Step : Create the subject area with dimension and fact columns as shown below


Step 2: Add the Narrative scripts as shown below

Prefix:

    <script type="text/javascript" src="https://www.google.com/jsapi"></script>
    <script type="text/javascript">
if(document.URL.indexOf("saw.dll?Answers") == -1) {
      google.load("visualization", "1", {packages:["treemap"]});
      google.setOnLoadCallback(drawHMChart);
}
      function drawHMChart() {
if(document.URL.indexOf("saw.dll?Answers") == -1) {
          // Create and populate the data table.
          var data = new google.visualization.DataTable();
          data.addColumn('string', 'Region');
          data.addColumn('string', 'Parent');
          data.addColumn('number', 'Revenue');
          data.addColumn('number', 'Quantity');
          myHMArray=[];
          myHMArray.push(["All Brands",null,0,0]);
}


Narrative :

myHMArray.push(["@1","All Brands",@2,@3]);


Postfix:

if(document.URL.indexOf("saw.dll?Answers") == -1) {
data.addRows(myHMArray);

          // Create and draw the visualization.
          var tree = new google.visualization.TreeMap(document.getElementById('div_Heatmap'));
          tree.draw(data, {
            minColor: '#f00',
            midColor: '#ddd',
            maxColor: '#0d0',
            headerHeight: 15,
            fontColor: 'black',
            showScale: true});
      }

   }
</script>
<b>Note: Revenue represented by size and Billed quantity represented by color</b>
    <div id="div_Heatmap" style="width: 900px; height: 500px;"></div>

Step 3: Results as shown below


Run a report without hitting the Database (Skip DB Querry Hit)

This can be useful for testing purposes to check syntax of SQL queries generated without really hitting the database.


SET VARIABLE SKIP_PHYSICAL_QUERY_EXEC=1, DISABLE_CACHE_HIT=1, DISABLE_CACHE_SEED=1;
 

Enable Log-Level from Advanced Tab - OBIEE 11g

In the Criteria -> Advanced tab, Add below tag in the prefix and click Apply SQL.


SET VARIABLE LOG_LEVEL = 2;

Check the Log from Administration > Manage Sessions.